How to draw a chart on Google Docs
Learn how to create charts and graphs in Google Docs to present numerical data clearly and effectively for better audience understanding at rrtutors.com.
Drawing graphs can be stressful and time-consuming, especially if your text editor does not provide a graph or chart drawing feature. Thankfully, Google Docs offers a "Chart" feature that can be used to create many different types of graphs including bars, columns, lines, and pie charts. Additionally, the feature allows you to add graphs directly from Google sheets.
The following steps will show you how to add graphs and charts into your Google Docs and customize them to meet your needs.
Steps on how to draw a chart or Graph on Google Docs
Creating a chart or graph in Google Docs is easy. Simply follow the steps below:
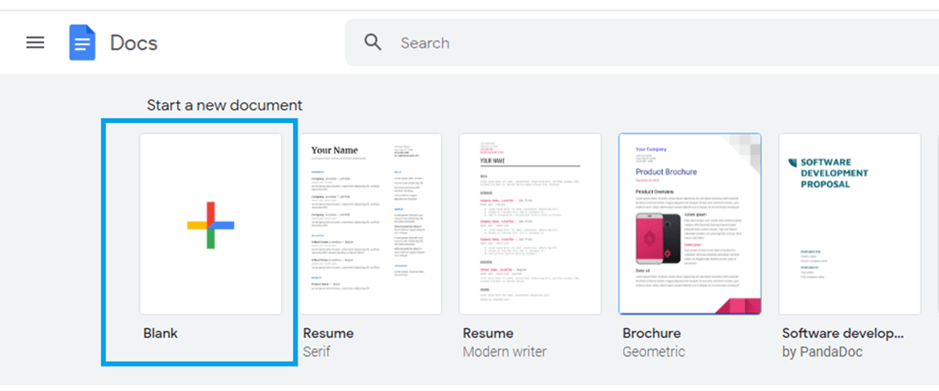
Step 1: Create a new document or open an existing one in Google Docs
 |
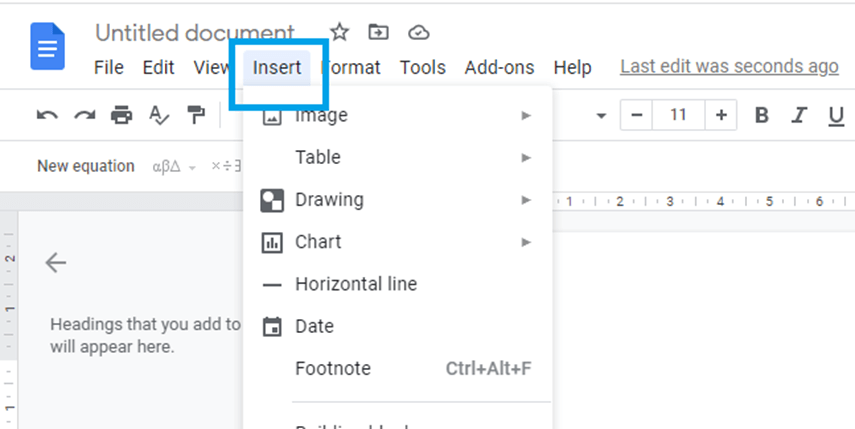
Step 2: On the Google Docs menu, click "Insert"
 |
Step 3: Hover over "chart" option from the "Insert" options menu
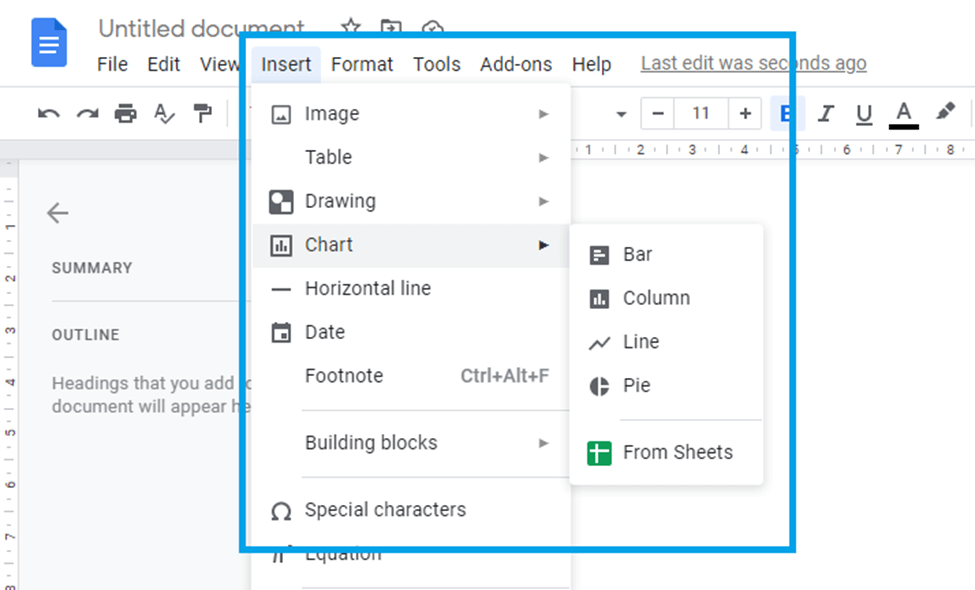 |
Step 4: Select the chart option and then choose either a bar graph, a column graph, a line graph, or a pie chart for your document.
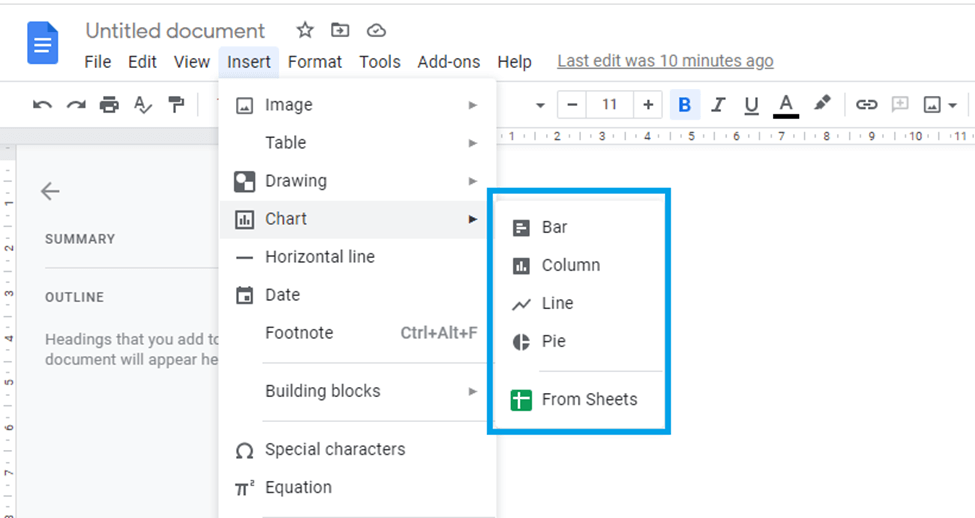 |
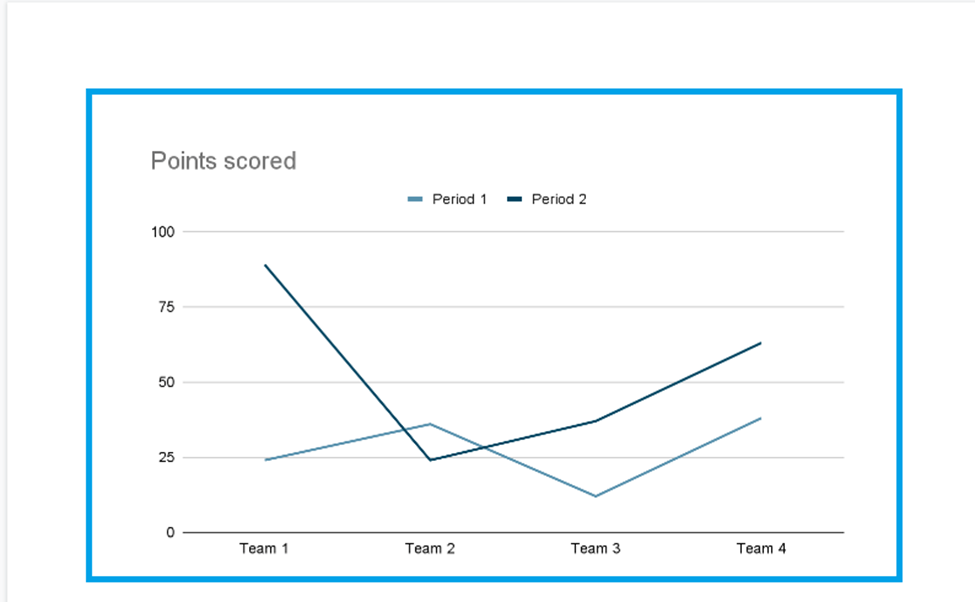
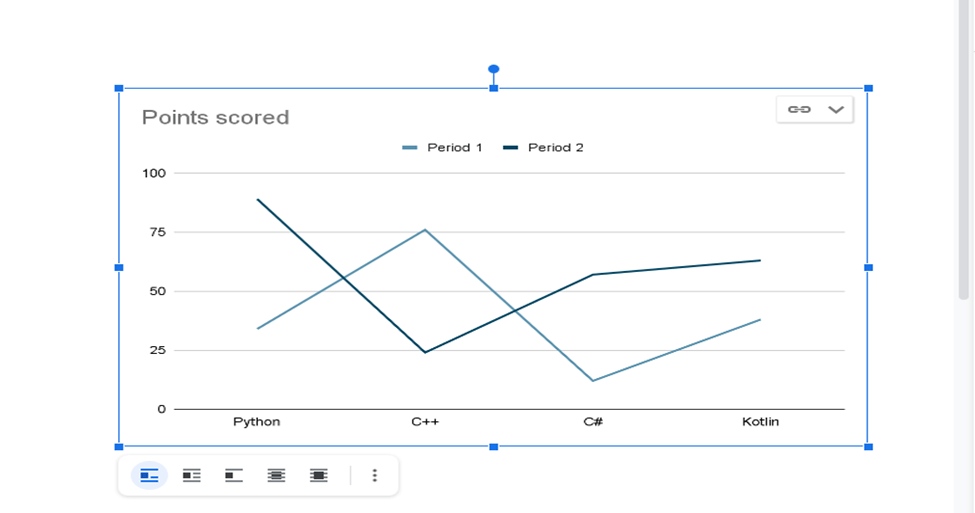
In this post, we will draw a line graph. Click on the "Line" graph and a line graph will be displayed on your document.
 |
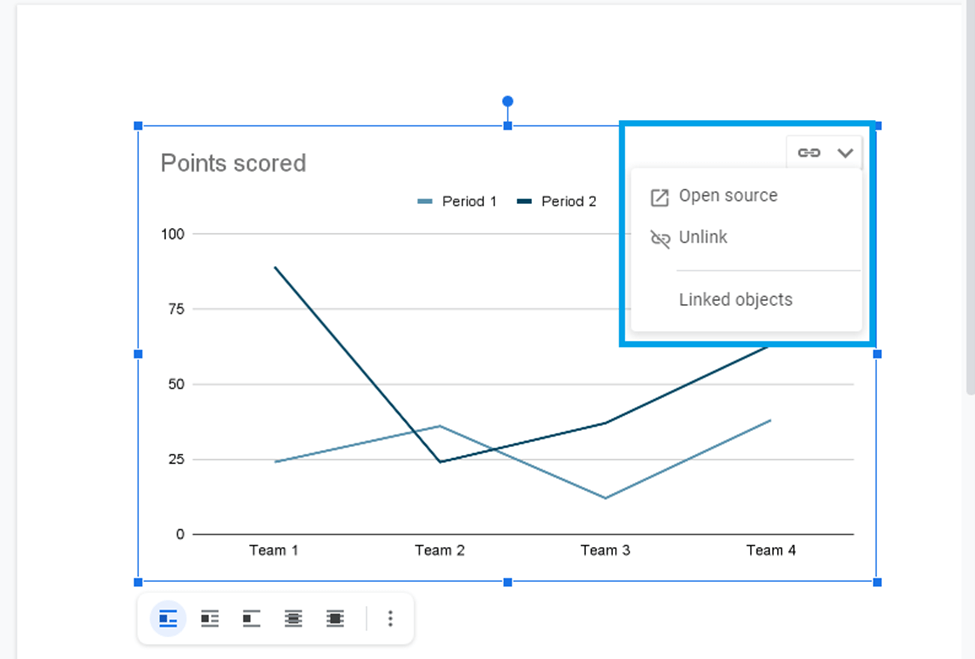
Step 5: Click on the "linked chart options" to modify your line graph. This option allows you to select the data values for your graph using the "open source" or "linked objects".
 |
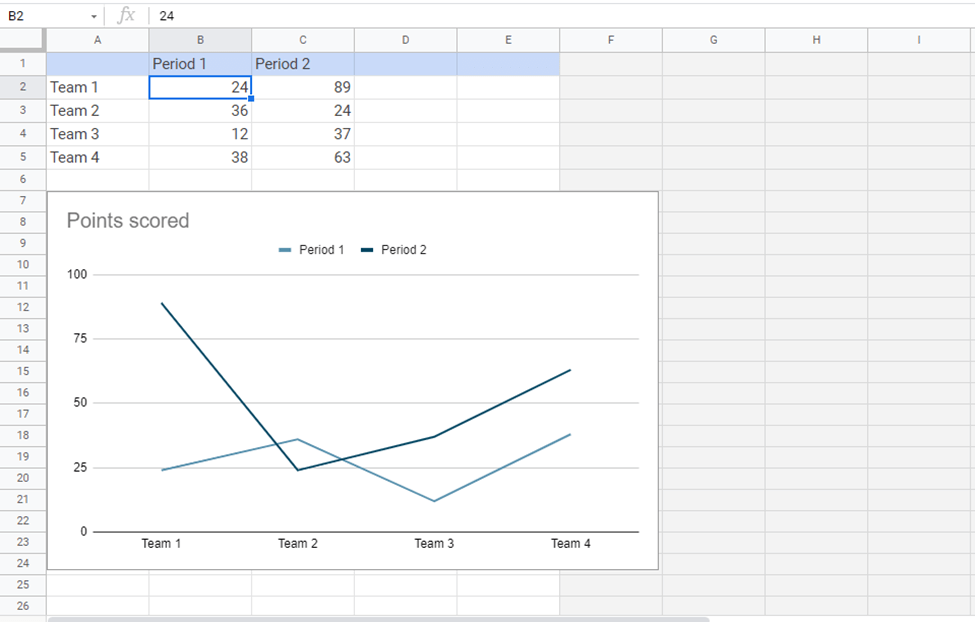
When you click “open source” in Google sheets, a table will appear in a new tab where you can enter your data to create a customized line graph.
 |
Step 7: Update your Google Docs chart. To do so, go back to your Google Docs tab and click on the update button at the top-right of the graph.
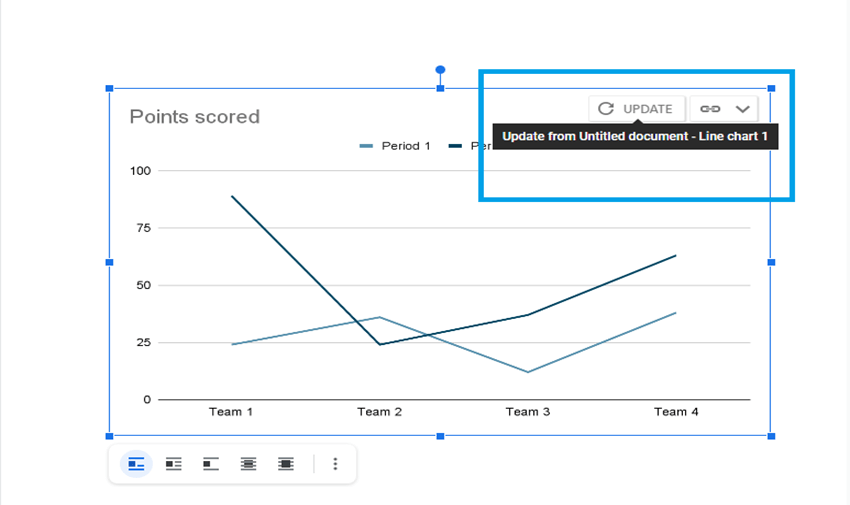 |
Instantly, your Graph will be updated.
 |
Conclusion
That's how you add a chart to Google Docs effortlessly. The upside of this Google Docs feature is that it allows you to make changes to your graph in a matter of seconds