Charts in Jetpack compose - Create Line Chart with Jetpack compose

Last updated Feb 11, 2022

In this Jetpack compose example, we will see how to create Line Chart using Jetpack Compose.Jetpack Compose is a cutting-edge toolkit for creating native Android user interfaces.It simplifies and accelerates UI development on Android by using minimal code, powerful tools, and explicit Kotlin APIs. Compose supports material design ideas. Many of its UI elements are built with material design in mind right out of the box.


Implementation

Step 1. Create a new Project in Android Studio.

File > New > New Project > Select (Empty Compose Activity) > Next > Enter Name (LineChartJetpack) > FINISH.

After creating the new project, Android Studio starts Gradle and builds your project, which may take a few seconds.

Step 2. At first, Open MainActivity.kt file

First we will create a composable function of LineChart() in which we create a card and inside card we use Column, canvas for drawing lines and so on..

@Composable
fun LineChart() {
    Card(
        modifier = Modifier
            .fillMaxWidth()
            .height(360.dp)
            .padding(16.dp),
        elevation = 10.dp
    ) {
        Column(
            modifier = Modifier
                .padding(16.dp)
                .wrapContentSize(align = Alignment.BottomStart)
        ) {
            Canvas(
                modifier = Modifier
                    .fillMaxWidth()
                    .height(250.dp)
            ) {
                val distance = size.width / (lineChartData().size + 1)
                var currentX = 0F
                val maxValue = lineChartData().maxOrNull() ?: 0
                val points = mutableListOf()

                lineChartData().forEachIndexed { index, data ->
                    if (lineChartData().size >= index + 2) {
                        val y0 = (maxValue - data) * (size.height / maxValue)
                        val x0 = currentX + distance
                        points.add(PointF(x0, y0))
                        currentX += distance
                    }
                }

                for (i in 0 until points.size - 1) {
                    drawLine(
                        start = Offset(points[i].x, points[i].y),
                        end = Offset(points[i + 1].x, points[i + 1].y),
                        color = Color(0xFF3F51B5),
                        strokeWidth = 8f
                    )
                }
            }
        }
    }
}

Now we will create a function lineChartData() which holds the values in integer, this functions have static values.

private fun lineChartData() = listOf(
    5929, 6898, 8961, 5674, 7122, 2092, 3427, 5520, 4680, 7418,
    4743, 4280, 12211, 7295, 9900, 12438, 11186, 5439, 4227, 5138,
    11015, 8386, 12450, 10411, 10852, 7782, 7371, 4983, 9234, 6847
)


Finally we will call our LineChart() function inside onCreate() function.

class MainActivity : ComponentActivity() {
    override fun onCreate(savedInstanceState: Bundle?) {
        super.onCreate(savedInstanceState)
        setContent {
            LineChartJetPackTheme {
                Surface(color = MaterialTheme.colors.background) {
                    Scaffold(
                        topBar = {
                            TopAppBar(
                                title = {
                                    Text(
                                        text = "Line Chart",
                                        modifier = Modifier.fillMaxWidth(),
                                        textAlign = TextAlign.Center
                                    )
                                }
                            )
                        }
                    ) {
                        LineChart()
                    }
                }
            }
        }
    }
}


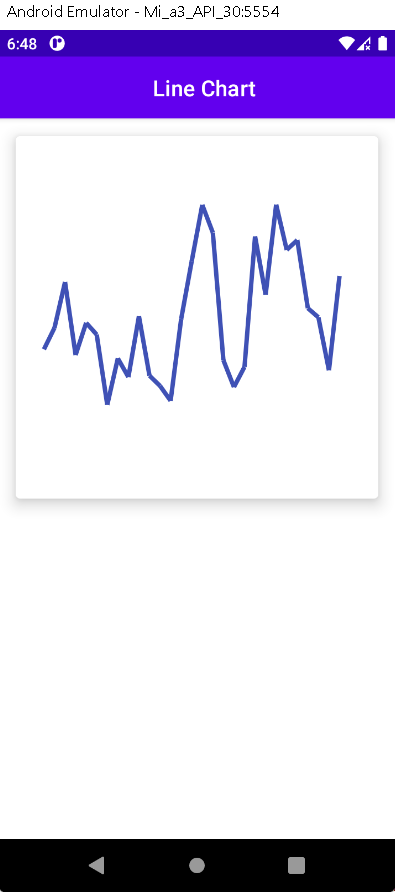
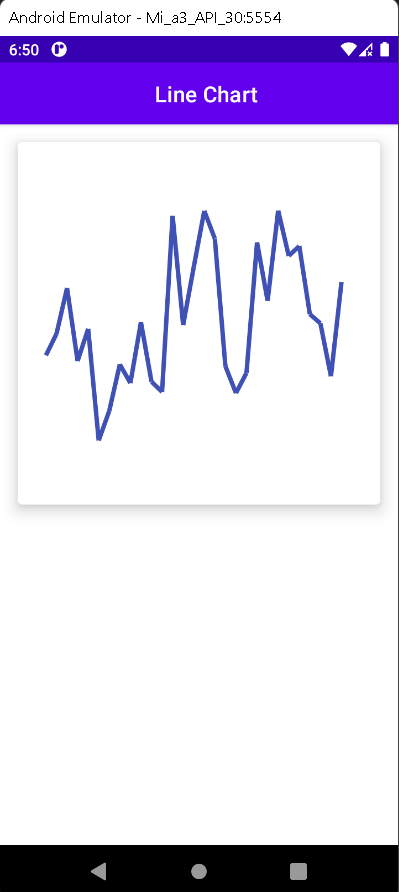
Step 3. Run the app in your emulator or real device and you will get the following output:

OUTPUT
 

Line Chart Using Jetpack compose


Line Chart using Jetpack compose example


Complete Source Code of Line Chart using Jetpack compose

MainActivity.kt file

import android.graphics.PointF
import android.os.Bundle
import androidx.activity.ComponentActivity
import androidx.activity.compose.setContent
import androidx.compose.foundation.Canvas
import androidx.compose.foundation.layout.*
import androidx.compose.material.*
import androidx.compose.runtime.Composable
import androidx.compose.ui.Alignment
import androidx.compose.ui.Modifier
import androidx.compose.ui.geometry.Offset
import androidx.compose.ui.graphics.Color
import androidx.compose.ui.text.style.TextAlign
import androidx.compose.ui.unit.dp
import com.nishajain.linechartjetpack.ui.theme.LineChartJetPackTheme

class MainActivity : ComponentActivity() {
    override fun onCreate(savedInstanceState: Bundle?) {
        super.onCreate(savedInstanceState)
        setContent {
            LineChartJetPackTheme {
                Surface(color = MaterialTheme.colors.background) {
                    Scaffold(
                        topBar = {
                            TopAppBar(
                                title = {
                                    Text(
                                        text = "Line Chart",
                                        modifier = Modifier.fillMaxWidth(),
                                        textAlign = TextAlign.Center
                                    )
                                }
                            )
                        }
                    ) {
                        LineChart()
                    }
                }
            }
        }
    }
}

//Static value
private fun lineChartData() = listOf(
    5929, 6898, 8961, 5674, 7122, 2092, 3427, 5520, 4680, 7418,
    4743, 4280, 12211, 7295, 9900, 12438, 11186, 5439, 4227, 5138,
    11015, 8386, 12450, 10411, 10852, 7782, 7371, 4983, 9234, 6847
)

@Composable
fun LineChart() {
    Card(
        modifier = Modifier
            .fillMaxWidth()
            .height(360.dp)
            .padding(16.dp),
        elevation = 10.dp
    ) {
        Column(
            modifier = Modifier
                .padding(16.dp)
                .wrapContentSize(align = Alignment.BottomStart)
        ) {
            Canvas(
                modifier = Modifier
                    .fillMaxWidth()
                    .height(250.dp)
            ) {
                val distance = size.width / (lineChartData().size + 1)
                var currentX = 0F
                val maxValue = lineChartData().maxOrNull() ?: 0
                val points = mutableListOf()

                lineChartData().forEachIndexed { index, data ->
                    if (lineChartData().size >= index + 2) {
                        val y0 = (maxValue - data) * (size.height / maxValue)
                        val x0 = currentX + distance
                        points.add(PointF(x0, y0))
                        currentX += distance
                    }
                }

                for (i in 0 until points.size - 1) {
                    drawLine(
                        start = Offset(points[i].x, points[i].y),
                        end = Offset(points[i + 1].x, points[i + 1].y),
                        color = Color(0xFF3F51B5),
                        strokeWidth = 8f
                    )
                }
            }
        }
    }
}


build.gradle(app) file

plugins {
    id 'com.android.application'
    id 'kotlin-android'
}

android {
    compileSdk 31

    defaultConfig {
        applicationId "com.nishajain.linechartjetpack"
        minSdk 21
        targetSdk 31
        versionCode 1
        versionName "1.0"

        testInstrumentationRunner "androidx.test.runner.AndroidJUnitRunner"
        vectorDrawables {
            useSupportLibrary true
        }
    }

    buildTypes {
        release {
            minifyEnabled false
            proguardFiles getDefaultProguardFile('proguard-android-optimize.txt'), 'proguard-rules.pro'
        }
    }
    compileOptions {
        sourceCompatibility JavaVersion.VERSION_1_8
        targetCompatibility JavaVersion.VERSION_1_8
    }
    kotlinOptions {
        jvmTarget = '1.8'
        useIR = true
    }
    buildFeatures {
        compose true
    }
    composeOptions {
        kotlinCompilerExtensionVersion compose_version
        kotlinCompilerVersion '1.5.21'
    }
    packagingOptions {
        resources {
            excludes += '/META-INF/{AL2.0,LGPL2.1}'
        }
    }
}

dependencies {

    implementation 'androidx.core:core-ktx:1.7.0'
    implementation 'androidx.appcompat:appcompat:1.4.1'
    implementation 'com.google.android.material:material:1.5.0'
    implementation "androidx.compose.ui:ui:$compose_version"
    implementation "androidx.compose.material:material:$compose_version"
    implementation "androidx.compose.ui:ui-tooling-preview:$compose_version"
    implementation 'androidx.lifecycle:lifecycle-runtime-ktx:2.4.0'
    implementation 'androidx.activity:activity-compose:1.4.0'
    testImplementation 'junit:junit:4.+'
    androidTestImplementation 'androidx.test.ext:junit:1.1.3'
    androidTestImplementation 'androidx.test.espresso:espresso-core:3.4.0'
    androidTestImplementation "androidx.compose.ui:ui-test-junit4:$compose_version"
    debugImplementation "androidx.compose.ui:ui-tooling:$compose_version"
}


Theme.kt file

import androidx.compose.foundation.isSystemInDarkTheme
import androidx.compose.material.MaterialTheme
import androidx.compose.material.darkColors
import androidx.compose.material.lightColors
import androidx.compose.runtime.Composable

private val DarkColorPalette = darkColors(
    primary = Purple200,
    primaryVariant = Purple700,
    secondary = Teal200
)

private val LightColorPalette = lightColors(
    primary = Purple500,
    primaryVariant = Purple700,
    secondary = Teal200

    /* Other default colors to override
    background = Color.White,
    surface = Color.White,
    onPrimary = Color.White,
    onSecondary = Color.Black,
    onBackground = Color.Black,
    onSurface = Color.Black,
    */
)

@Composable
fun LineChartJetPackTheme(
    darkTheme: Boolean = isSystemInDarkTheme(),
    content: @Composable() () -> Unit
) {
    val colors = if (darkTheme) {
        DarkColorPalette
    } else {
        LightColorPalette
    }

    MaterialTheme(
        colors = colors,
        typography = Typography,
        shapes = Shapes,
        content = content
    )
}


Conclusion: In this article we have covered how to create Line Chart using JetPack Compose.

Jetpack compose Chart Examples

Create Bar Chart with Jetpack compose

Create Pie Chart with Jetpack compose

Article Contributed By :
https://www.rrtutors.com/site_assets/profile/assets/img/avataaars.svg

1699 Views