Charts in Jetpack compose - Create Pie Chart with Jetpack compose

Last updated Feb 11, 2022

In this example, we will see how to create Pie Chart using Jetpack Compose.Jetpack Compose is a cutting-edge toolkit for creating native Android user interfaces.It simplifies and accelerates UI development on Android by using minimal code,
powerful tools, and explicit Kotlin APIs. Compose supports material design ideas. Many of its UI elements are built with material design in mind right out of the box.


Implementation

Step 1. Create a new Project in Android Studio.

File > New > New Project > Select (Empty Compose Activity) > Next > Enter Name (PieChartJetpack) > FINISH.

After creating the new project, Android Studio starts Gradle and builds your project, which may take a few seconds.


Step 2.  At first, Open MainActivity.kt file

First we will create a composable function of PieChart() in which we use Canvas for displaying chart, create color list, point list, animate chart UI and so on..

@Composable
fun PieChart() {
    val context = LocalContext.current
    val point = listOf(10f, 40f, 25f, 85f, 100f, 65f, 70f)
    val color = listOf(
        Color.Blue,
        Color.Yellow,
        Color.Green,
        Color.Gray,
        Color.Red,
        Color.Black,
        Color.Cyan
    )
    val sum = point.sum()
    var startAngle = 0f
    val radius = 300f
    val rect = Rect(Offset(-radius, -radius), Size(2 * radius, 2 * radius))
    val path = Path()
    val angles = mutableListOf()
    var start by remember { mutableStateOf(false) }
    val sweepPre by animateFloatAsState(
        targetValue = if (start) 1f else 0f,
        animationSpec = FloatTweenSpec(duration = 1000)
    )
    Canvas(
        modifier = Modifier
            .fillMaxWidth()
            .padding(start = 30.dp)
            .height(350.dp)
            .pointerInput(Unit) {
                detectTapGestures(
                    onTap = {
                        val x = it.x - radius
                        val y = it.y - radius
                        var touchAngle = Math.toDegrees(Math.atan2(y.toDouble(), x.toDouble()))
                        if (x < 0 && y < 0 || x > 0 && y < 0) {
                            touchAngle += 360
                        }
                        val position =
                            getPositionFromAngle(touchAngle = touchAngle, angles = angles)
                        Toast
                            .makeText(context, "onTap: $position", Toast.LENGTH_SHORT)
                            .show()
                    }
                )
            }
    ) {
        translate(radius, radius) {
            start = true
            for ((i, p) in point.withIndex()) {
                val sweepAngle = p / sum * 360f
                path.moveTo(0f, 0f)
                path.arcTo(rect = rect, startAngle, sweepAngle * sweepPre, false)
                angles.add(sweepAngle)
                drawPath(path = path, color = color[i])
                path.reset()
                startAngle += sweepAngle
            }
        }
    }
}


Now we will create a function getPositionFromAngle() which will help to get position by clicking on chart


private fun getPositionFromAngle(
    angles: List,
    touchAngle: Double
): Int {
    var totalAngle = 0f
    for ((i, angle) in angles.withIndex()) {
        totalAngle += angle
        if (touchAngle <= totalAngle) {
            return i
        }
    }
    return -1
}


Finally we will call our PieChart() function inside onCreate() function, we will use scaffold and TopAppBar for display the title in action bar.

class MainActivity : ComponentActivity() {
    override fun onCreate(savedInstanceState: Bundle?) {
        super.onCreate(savedInstanceState)
        setContent {
            PieChartJetpackTheme() {
                Surface(color = MaterialTheme.colors.background) {
                    Scaffold(
                        topBar = {
                            TopAppBar(
                                title = {
                                    Text(
                                        text = "Pie Chart Jetpack",
                                        modifier = Modifier.fillMaxWidth(),
                                        textAlign = TextAlign.Center
                                    )
                                }
                            )
                        }
                    ) {
                        Column(
                            modifier = Modifier.fillMaxSize(),
                            verticalArrangement = Arrangement.Center,
                            horizontalAlignment = Alignment.CenterHorizontally
                        ) {
                            PieChart()
                        }
                    }
                }
            }
        }
    }
}


Complete code for Pie Chart in Jetpack compose

import android.os.Bundle
import android.widget.Toast
import androidx.activity.ComponentActivity
import androidx.activity.compose.setContent
import androidx.compose.animation.core.FloatTweenSpec
import androidx.compose.animation.core.animateFloatAsState
import androidx.compose.foundation.Canvas
import androidx.compose.foundation.gestures.detectTapGestures
import androidx.compose.foundation.layout.*
import androidx.compose.material.*
import androidx.compose.runtime.*
import androidx.compose.ui.Alignment
import androidx.compose.ui.Modifier
import androidx.compose.ui.geometry.Offset
import androidx.compose.ui.geometry.Rect
import androidx.compose.ui.geometry.Size
import androidx.compose.ui.graphics.Color
import androidx.compose.ui.graphics.Path
import androidx.compose.ui.graphics.drawscope.translate
import androidx.compose.ui.input.pointer.pointerInput
import androidx.compose.ui.platform.LocalContext
import androidx.compose.ui.text.style.TextAlign
import androidx.compose.ui.unit.dp
import com.nishajain.piechartjetpack.ui.theme.PieChartJetpackTheme

class MainActivity : ComponentActivity() {
    override fun onCreate(savedInstanceState: Bundle?) {
        super.onCreate(savedInstanceState)
        setContent {
            PieChartJetpackTheme() {
                Surface(color = MaterialTheme.colors.background) {
                    Scaffold(
                        topBar = {
                            TopAppBar(
                                title = {
                                    Text(
                                        text = "Pie Chart Jetpack",
                                        modifier = Modifier.fillMaxWidth(),
                                        textAlign = TextAlign.Center
                                    )
                                }
                            )
                        }
                    ) {
                        Column(
                            modifier = Modifier.fillMaxSize(),
                            verticalArrangement = Arrangement.Center,
                            horizontalAlignment = Alignment.CenterHorizontally
                        ) {
                            PieChart()
                        }
                    }
                }
            }
        }
    }
}

private fun getPositionFromAngle(
    angles: List,
    touchAngle: Double
): Int {
    var totalAngle = 0f
    for ((i, angle) in angles.withIndex()) {
        totalAngle += angle
        if (touchAngle <= totalAngle) {
            return i
        }
    }
    return -1
}

@Composable
fun PieChart() {
    val context = LocalContext.current
    val point = listOf(10f, 40f, 25f, 85f, 100f, 65f, 70f)
    val color = listOf(
        Color.Blue,
        Color.Yellow,
        Color.Green,
        Color.Gray,
        Color.Red,
        Color.Black,
        Color.Cyan
    )
    val sum = point.sum()
    var startAngle = 0f
    val radius = 300f
    val rect = Rect(Offset(-radius, -radius), Size(2 * radius, 2 * radius))
    val path = Path()
    val angles = mutableListOf()
    var start by remember { mutableStateOf(false) }
    val sweepPre by animateFloatAsState(
        targetValue = if (start) 1f else 0f,
        animationSpec = FloatTweenSpec(duration = 1000)
    )
    Canvas(
        modifier = Modifier
            .fillMaxWidth()
            .padding(start = 30.dp)
            .height(350.dp)
            .pointerInput(Unit) {
                detectTapGestures(
                    onTap = {
                        val x = it.x - radius
                        val y = it.y - radius
                        var touchAngle = Math.toDegrees(Math.atan2(y.toDouble(), x.toDouble()))
                        if (x < 0 && y < 0 || x > 0 && y < 0) {
                            touchAngle += 360
                        }
                        val position =
                            getPositionFromAngle(touchAngle = touchAngle, angles = angles)
                        Toast
                            .makeText(context, "onTap: $position", Toast.LENGTH_SHORT)
                            .show()
                    }
                )
            }
    ) {
        translate(radius, radius) {
            start = true
            for ((i, p) in point.withIndex()) {
                val sweepAngle = p / sum * 360f
                path.moveTo(0f, 0f)
                path.arcTo(rect = rect, startAngle, sweepAngle * sweepPre, false)
                angles.add(sweepAngle)
                drawPath(path = path, color = color[i])
                path.reset()
                startAngle += sweepAngle
            }
        }
    }
}


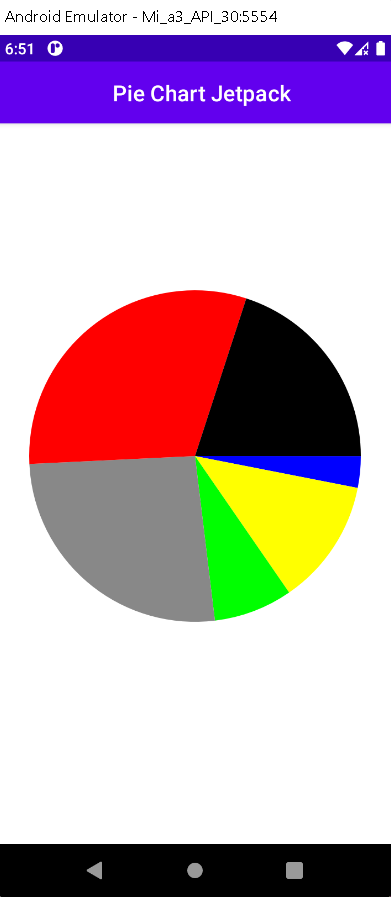
Step 3. Run the app in your emulator or real device and you will get the following output:

OUTPUT

Pie Chart using Jetpack compose


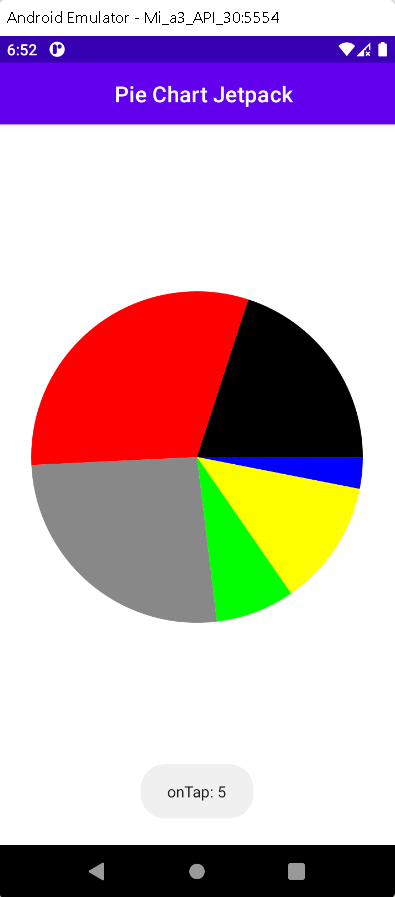
When Tap on Red Space


Pie Chart using Jetpack compose 2


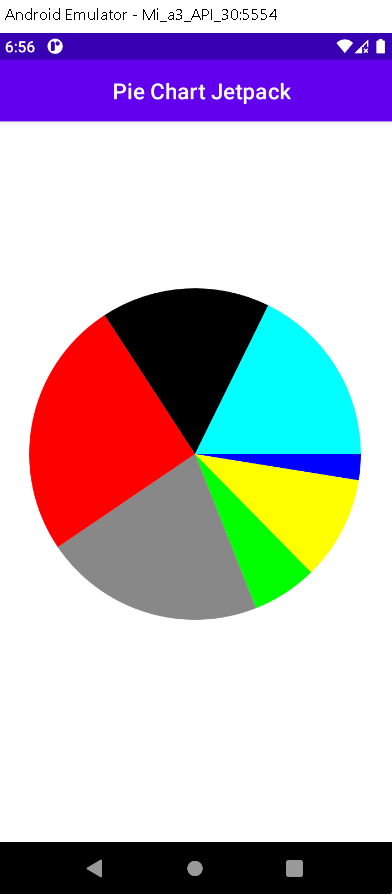
Added One more angle


Pie Chart using jetpack compose example


Conclusion: In this article we have covered how to create Pie Chart using JetPack Compose and handle click event on chart
 

Jetpack compose Chart Examples

Create Bar Chart with Jetpack compose

Create Line Chart with Jetpack compose

Article Contributed By :
https://www.rrtutors.com/site_assets/profile/assets/img/avataaars.svg

46 Views