How to Create Simple Pie Chart in Flutter
Create Simple Pie Chart with Flutter application
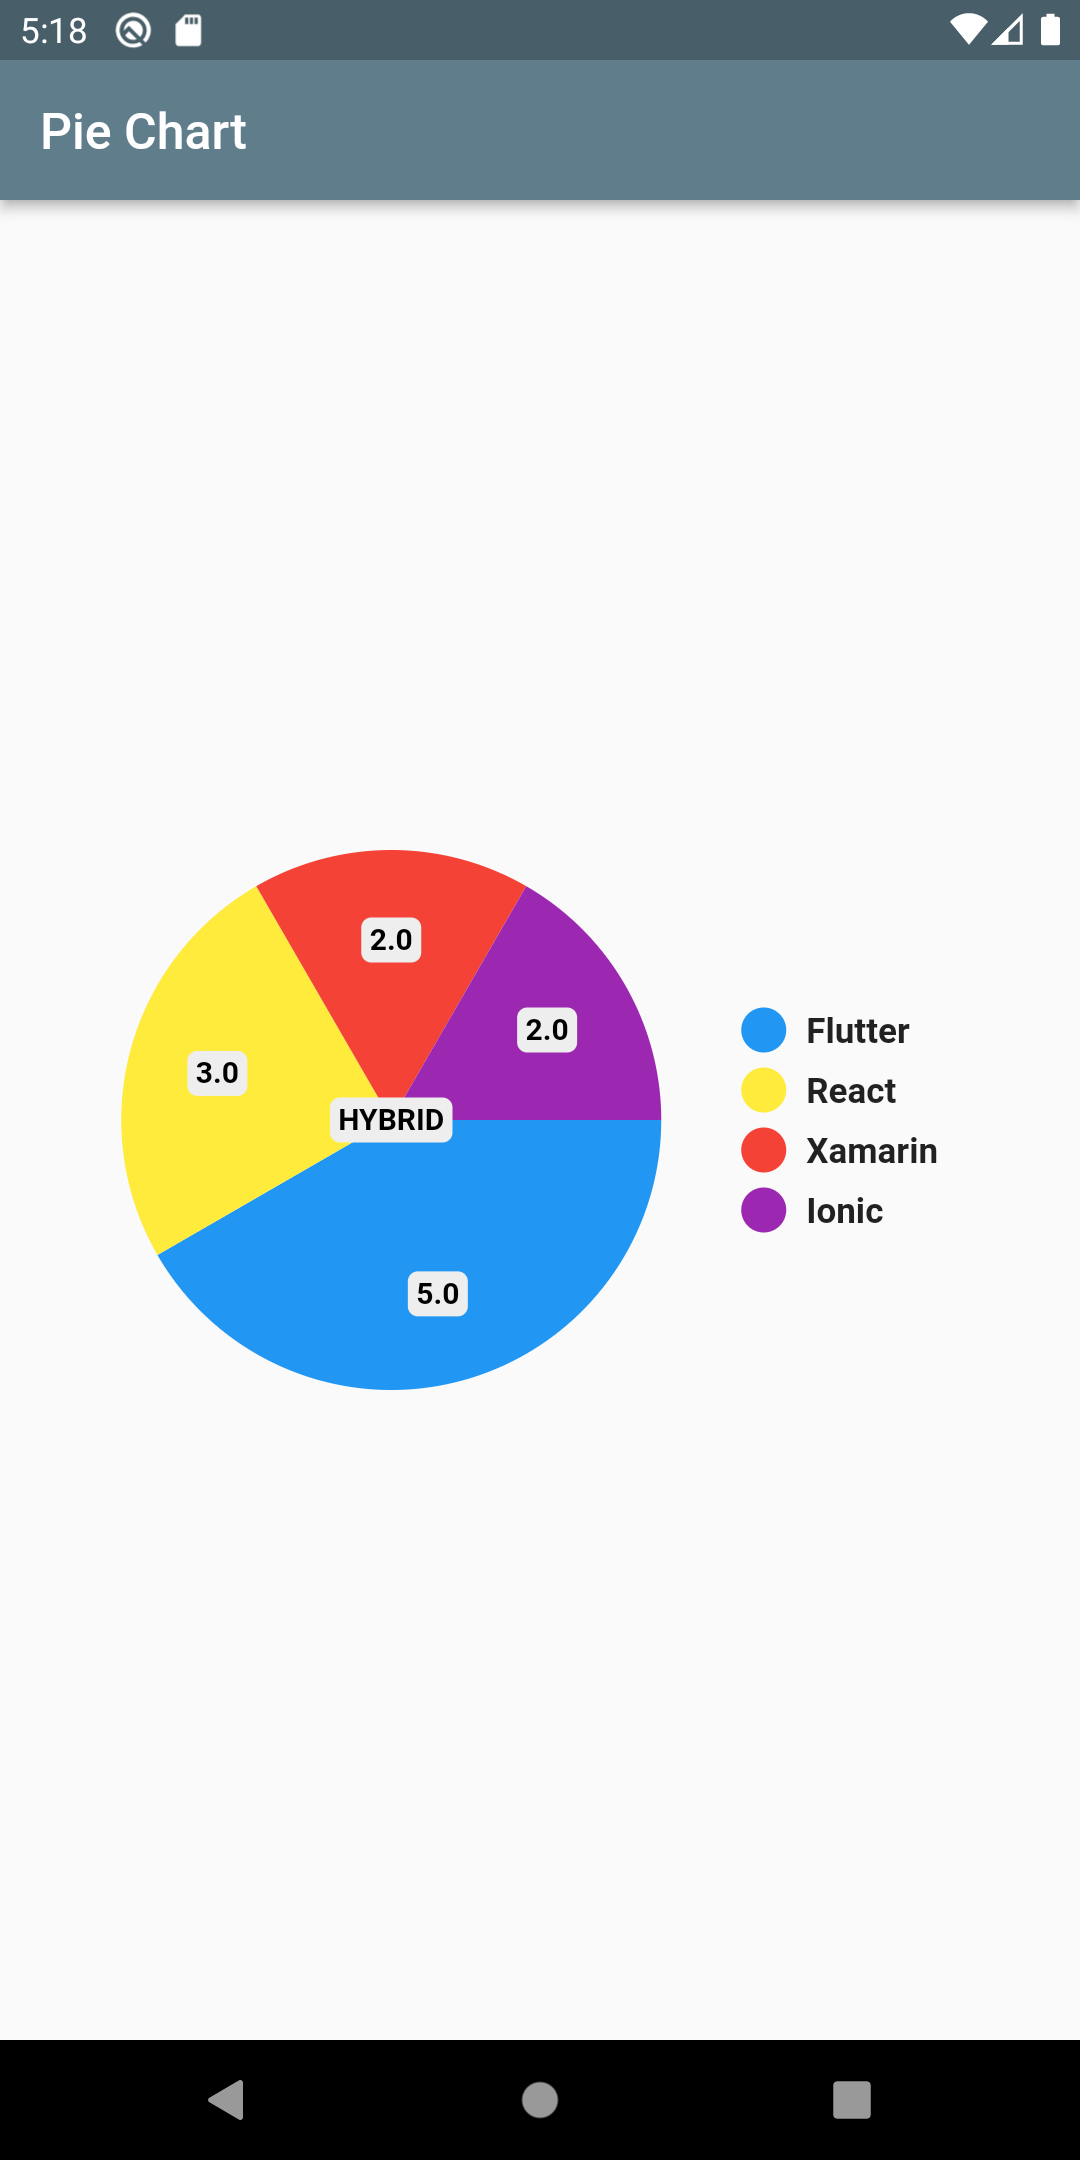
A pie chart is a circular statistical graphic, which is divided into slices to illustrate numerical proportion. so, In today's we will see a package that lets you create a simple pie chart in Flutter.
Let's start
Step 1: Create a new Flutter Application.
Step 2: Add a line like this to your package's pubspec.yaml
|
Step 3: Now Once it is installed you will get access to a widget called piechart. now you will have to get data into a map that will have the title of the slice and the portion of the type integer.
for example
|
Map dataMap = { "Flutter": 5, "React": 3, "Xamarin": 2, "Ionic": 2, }; |
Also, create a list of Colors that has the same number equal to the data in the map list. for example, map list has 4 data then the color list should have 4 colors.
Step 4: Now simply call or write a widget called PieChart where you want a chart to show and with that you will get different properties
-
dataMap - which will take the data map you created.
-
chartRadius - which will decide the size of the pie chart.
-
colorList - which will take the colors list.
-
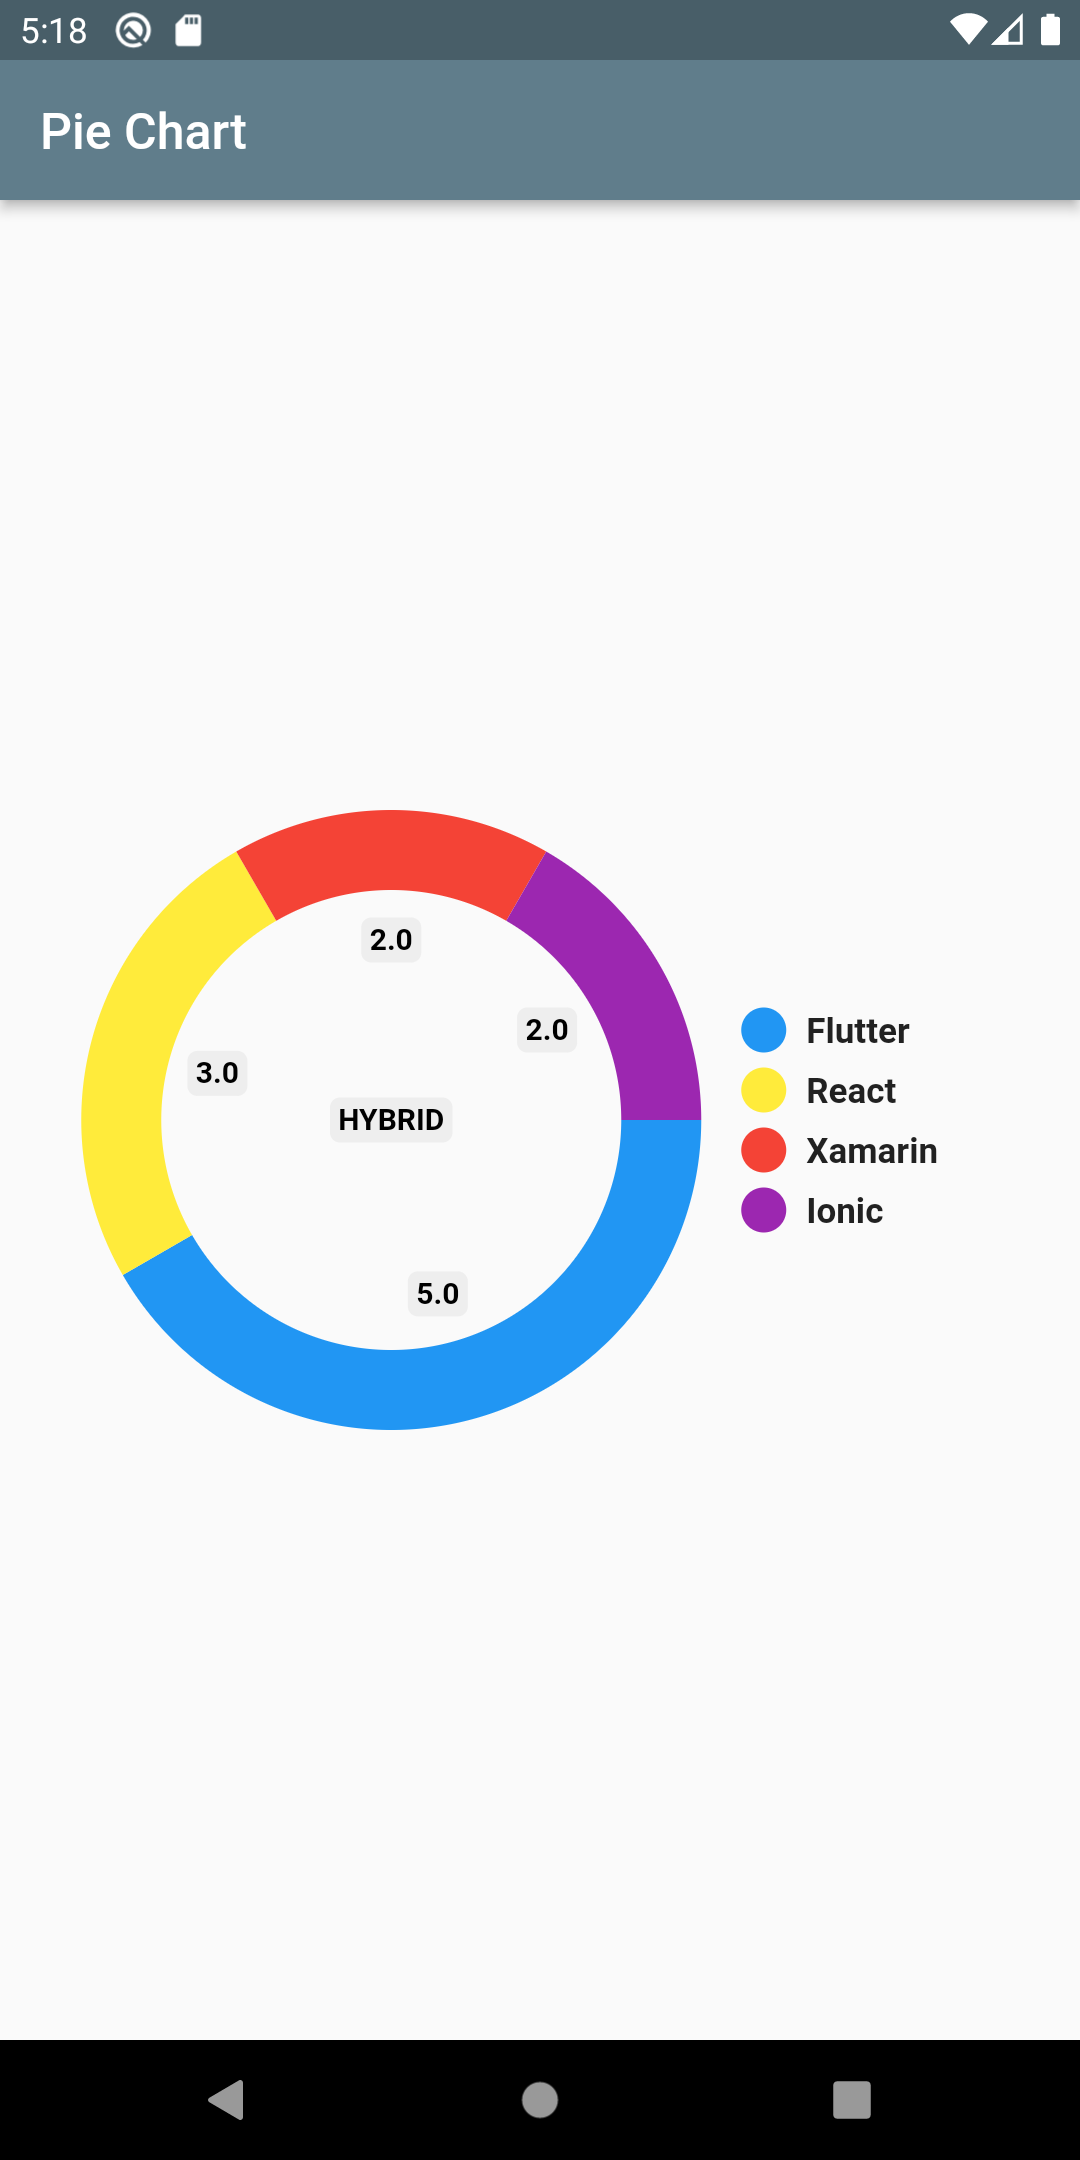
chartType - decides the type of the pie chart(ring or disc).
-
centerText - will let you add text in the center of the chart.
for example:
|
PieChart( dataMap: dataMap, animationDuration: Duration(milliseconds: 800), chartLegendSpacing: 32, chartRadius: MediaQuery.of(context).size.width / 3.2, colorList: [ Colors.blue, Colors.yellow, Colors.red, Colors.purple ], initialAngleInDegree: 0, chartType: ChartType.disc, ringStrokeWidth: 32, centerText: "HYBRID", legendOptions: LegendOptions( showLegendsInRow: false, legendPosition: LegendPosition.right, showLegends: true, legendShape: BoxShape.circle, legendTextStyle: TextStyle( fontWeight: FontWeight.bold, ), ), chartValuesOptions: ChartValuesOptions( showChartValueBackground: true, showChartValues: true, showChartValuesInPercentage: false, showChartValuesOutside: false, decimalPlaces: 1, ), // gradientList: ---To add gradient colors--- // emptyColorGradient: ---Empty Color gradient--- ) |
Compler example Code to create Pie Chart in flutter
|
import 'package:flutter/foundation.dart'; import 'package:flutter/material.dart'; import 'package:pie_chart/pie_chart.dart';
void main() { runApp(MyApp()); }
class MyApp extends StatelessWidget { @override Widget build(BuildContext context) { return MaterialApp( debugShowCheckedModeBanner: false, title: 'Pie Chart Demo', theme: ThemeData( primarySwatch: Colors.blueGrey, ), darkTheme: ThemeData( primarySwatch: Colors.blueGrey, brightness: Brightness.dark, ), home: HomePage(), ); } }
class HomePage extends StatefulWidget { HomePage({Key? key}) : super(key: key);
@override _HomePageState createState() => _HomePageState(); }
class _HomePageState extends State { Map dataMap = { "Flutter": 5, "React": 3, "Xamarin": 2, "Ionic": 2, };
@override Widget build(BuildContext context) { return Scaffold( appBar: AppBar( title: const Text('Pie Chart'), ), body: Column( mainAxisAlignment: MainAxisAlignment.center, children: [ PieChart( dataMap: dataMap, animationDuration: Duration(milliseconds: 800), chartLegendSpacing: 32, chartRadius: MediaQuery.of(context).size.width / 2, colorList: [ Colors.blue, Colors.yellow, Colors.red, Colors.purple ], initialAngleInDegree: 0, chartType: ChartType.ring, ringStrokeWidth: 32, centerText: "HYBRID", legendOptions: LegendOptions( showLegendsInRow: false, legendPosition: LegendPosition.right, showLegends: true, legendShape: BoxShape.circle, legendTextStyle: TextStyle( fontWeight: FontWeight.bold, ), ), chartValuesOptions: ChartValuesOptions( showChartValueBackground: true, showChartValues: true, showChartValuesInPercentage: false, showChartValuesOutside: false, decimalPlaces: 1, ), // gradientList: ---To add gradient colors--- // emptyColorGradient: ---Empty Color gradient--- ) ], ), ); } }
|
Output:
 |
 |
Conclusion: In this way, we have learned how you can use PieChart widget to create a simple beautiful pie chart in Flutter.